

This Topic Never Matters - Until it Matters

July 23, 2025
On a personal note, today’s topic is fascinating to me in that it is a very important topic, perhaps the most important topic for the stock market in the grand scheme of things, and yet, it means next to nothing on a weekly, monthly, and even quarterly basis.
Offered a bit differently, we could offer that this is the most important consideration for the stock market, and yet, it offers nothing relative to aiding in gauging the near-term direction of the stock market.
If that sounds a bit crazy, welcome to my fascination, born through decades of market analysis, study, participation, and general observation.
My developing younger self went through a process of being flabbergasted at how a literal essential ingredient in the stock market mix, to include down to individual companies, could mean just about nothing in the general here and now for the stock market’s trend.
It gets even stranger.
Interestingly, while this topic offers nothing as X weeks and months unfold relative to the stock market’s direction, then, once it finally does matter, it consumes collective market participants as though it is the only ingredient worthy of consideration for the stock market at large.
It is as though collective market participants have an “oh no, what were we thinking” experience and realize they have bid up the stock market to unjustifiable valuation levels, and through this, the view that said valuation issues need to be addressed ASAP.
This, of course, occurs via collective participants adjusting stock prices much lower in quick fashion. They adjust the valuation concern via lower prices.
The One-Liner That Makes it Make Sense
For my part personally, after much study, observation, and participation in markets generally, the light bulb clicked on with a simple line relative to the valuation dilemma: Valuations never matter until they do, and when they do, they really matter!
That may sound so simplistic that it offers zero guidance, but its simplicity tells the truth down to its core.
Valuation levels of X market do not matter until they do. When they do, you better be versed in the valuation level, the history of it, and where we are relative to its history for any particular valuation metric you may be observing, lest you get run over via collective market participants rushing to reversion to the mean.
Reduced to extreme simplicity, reversion to the mean offers that when an extreme level is reached, it will revert back to its average.
Offered even more simply: Bye-bye extreme, hello average.
Personal observation/experience offers, don’t be surprised if it reverts to below its average. When collective market participants go to full-on adjustment mode, their collective fear often cares little for where the exact average was located on the valuation scale.
So, what is this Valuation Lingo all About?
Valuation places price into context.
“The S&P 500 closed at $6300 today, and in other news...”
The stated closing price of the S&P tells you next to nothing in and of itself. As a hypothetical example only, if the collective companies that make up the S&P collectively reported trailing twelve-month earnings of $200, the S&P’s price of $6300 would be posting an earnings valuation of 31 times earnings.
If the trailing twelve-month earnings were double that, coming in at $400, the S&P would be posting an earnings valuation of 15 times earnings. In this case the earnings made by the collective S&P 500 companies are used as the valuation metric.
The same can be done for their collective sales, known as the price-to-sales measure, for cash flow, and for the last 10 years average smoothed earnings, as another example. There are many valuation approaches and metrics, with some more popular than others. The list is long.
The overarching theme is to value the current dollar quoted index price in the context of a valuation study. The valuation measure used is then placed into its own historical context to offer whether the stock market, or individual stock, is historically expensive or even cheap.
From here, there are a plethora of additional views/questions to entertain to help conclude whether the valuation level is extreme, be it high or low.
General interest rate levels, i.e., the cost of money, play a role in the analysis as well as the geopolitical landscape to include the general socioeconomic landscape. Lots of factors play a role in analyzing valuation levels.
As a drilled-down note, it is all the big-picture inputs, as well as more micro inputs, that play a notable role with collective market participants’ willingness to push valuation levels to what seems like extreme levels.
We offer “what seems like extreme levels” because before you know it, said valuation levels can move higher and even higher. This is why we offered above that this topic offers very little aid in gauging market direction, in particular near-term direction.
To pick an arbitrary valuation level to represent the absolute top is a fool’s errand. At the same time, to be oblivious to valuation levels is asking for downstream trouble.
On a personal note, I often offer that it is important to know the quality of the water your capital is swimming in. Valuation tools offer a measure for said water.
Hours Worked
Below we offer a valuation measure that encompasses the big picture stock market landscape while also bringing into it the average wage earners economic experience.
This places the stock market into the context of average wages, which is another valuation approach.
This also is an additional way of continuing to look at our Capital vs. Labor view, a topic we opened up back in early April. That is a storyline that will unfold at a glacial pace, so we fully expect to continue to look at the topic, in more detail than this edition can address, as time unfolds.
The extreme short of it is that Capital, relative to Labor, has thrived and then some in comparison to Labor in recent decades. Again, keeping this extremely short for this edition, increased globalization expanded the labor force available to Capital on a massive scale.
With this, the domestic labor camp experienced a notable decrease in bargaining power. This left Capital in the proverbial driver’s seat, resulting in increased profit margins, increased profits, and an increased slice of the economic pie relative to Labor.
In what might seem strange to some, this can actually be deciphered in our “hours worked” valuation chart below. This, while we simultaneously place stock market prices into context via the average wage earners economic experience.
www.thechartstore.com
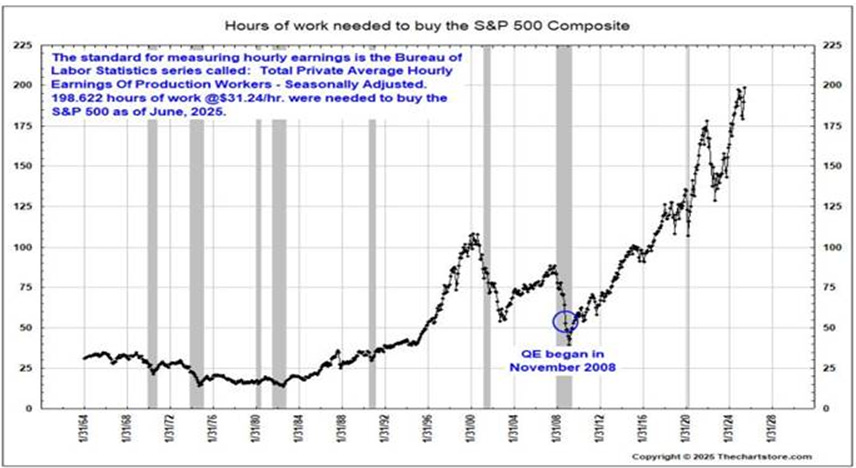
We offer the above 60-year chart courtesy of Ron over at the Chart Store. The chart depicts the trend of the number of hours worked it takes to purchase the S&P 500 index using the Bureau of Labor Statistics (BLS) Total Private Average Hourly Earnings measure.
For example, for the bulk of the 1970s and early 1980s, it took approximately 20 hours of work, using the BLS Private Average Hourly Earnings measure, to buy the S&P 500 quoted index price. Fast-forwarding to today, it now takes 10 times that level of hours worked, coming in at 200 hours, to purchase the S&P 500 index. Let that sink in.
(And you thought the housing market trajectory has gotten out of hand relative to incomes in recent decades eh!?)
Looking at the chart in its totality, we can see the stock market is priced at ever higher levels of hours worked.
Along the path, speaking to our earlier point that valuation levels do not aid in near-term stock market direction, we can see, as one could think the above metric could not go any higher, it would exceed that level and move onward and upward.
For their part, collective market participants have been willing to bid stock prices ever higher over recent decades with the recognition of Capital’s ever larger profit margins as offered through our aforementioned Capital vs. Labor view, in conjunction with technology-led production efficiency.
In defense of collective market participants bidding stock prices so high relative to wages (and other metrics that corroborate this valuation story), along the path of this chart, they have priced in victory, if you will, of Capital which has resulted in historic profit margins as well as a historically larger slice of the economic pie.
Interestingly, this chart could easily be used to solely depict just how much Capital has thrived relative to the storyline of Labor, via average wages, in recent decades. This chart tells a remarkable story.
Relative to the above as a stock market valuation metric, we can see the above chart speaks for itself. Valuation levels, via this metric, are off-the-charts. Corroboration, as we often offer, is the key. Other valuation measures tell a similar story, albeit to differing degrees.
If/when, it is always “a when” in markets, anything comes along in the socioeconomic landscape that offers notable concerns to participants that profit margins will be threatened, they have proven they can get real concerned real fast. Hence, our consistent obsession with market-based behaviors and economic tea leaves relative to any incoming potential recession issue.
For now the stock market is quite expensive on many valuation measurements, and as always, that offers next to nothing in terms of near-term forward guidance on market trend. Valuations simply do not matter, until they matter.
I wish you well…
-Ken from Mind Your Stops