

This has been Abnormal Stock Market Behavior when Viewed Through a Historical Lens
January 29, 2025

If we dial the calendar back a few years and discuss the stock market in very general terms it would go something like we had a significant socioeconomic shock to the system via Covid-19 circa 2020 which in-turn ushered in a cliff-dive for stock market prices.
We then seen some stabilizing in market prices at lower levels which in-turn led to a quick rebound to the levels seen before the Covid cliff-dive. Several months of back and forth trading then led to stock prices continuing higher for a notable uptrend for the remainder of 2020 on through 2021.
This then walked into the consistent and yet rapid descent of stock prices as we began and moved through year 2022. For perspective, certain well recognized stock indices were down 25% to 35% in less than a year.
From the bottoming price action of late fall season 2022 the stock market then proceeded to go on a rebounding upward move which then led to continued highs via an on-going uptrend in prices.
Wait, let’s check the above paragraph and restate it more specifically and accurately.
That is, from the bottoming price action of late fall season 2022 some areas of the stock market went onto posting higher levels via an on-going uptrend in prices while other areas have strangely been comparatively ignored by collective market participants.
In addition, a stock market relationship disconnect rapidly developed which has held in place since late 2022 and speaks to how limited areas of the stock market have been the true performers while many other areas have waffled around. This relationship disconnect offers itself when viewed through an historical lens.
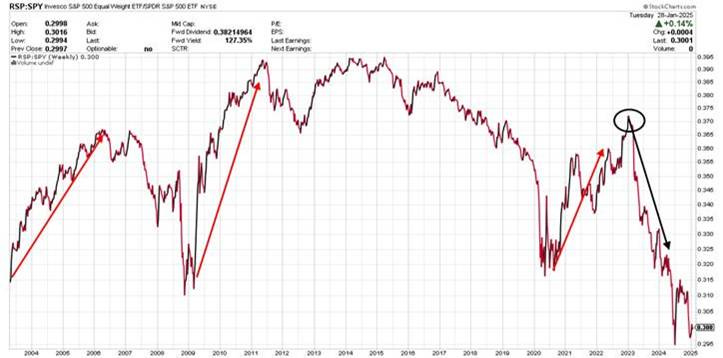
Click For Larger View: https://schrts.co/nyecEeUV
Above we are sharing said historical disconnect within the stock market. The chart depicts the interaction of two different S&P 500 vehicles. Wait you may think; when did two different S&P 500 benchmarks show up?
The traditionally cited S&P 500 is a weighted index of 500 companies. In light of the weighting some companies impact the performance of the index far more than other companies. With this a couple handfuls of companies can and do have an outsized impact on the performance of the traditionally cited S&P 500.
Conversely, there is another way to measure the performance of all 500 companies comprising the S&P 500 which is to equally weight them. In this measure no one company has an outsized impact on the performance of the Equal Weight S&P 500 index as they are all weighted equally within the metric.
By comparing the performance of the two against one another (as above) we can see if one type of measure is handily outperforming the other. Through this it is one of many ways to gauge the general structural health of the stock market.
This is especially applicable when coming out of a notable downturn in the stock market whereby the view of a “new bull market” has begun. An example would be coming out of the aforementioned 2022 rough downturn.
Traditionally, new bull markets are powerful and broad with an overall structural health that offers an abundance of opportunities for notable trends across the market spectrum.
Opportunities are so plentiful and broad everywhere you look, be it sectors, sub-industries down to individual stocks, opportunities abound for positive investment results.
This takes us back to the above chart that dates back to late 2003.
From there we begin our highlights, via our red arrows of the solid out-performance of the Equal Weight S&P 500 index as compared to the Weighted S&P 500. (When the line is rising the broad Equal Weight S&P measure is outperforming the Weighted S&P measure.)
Note the solid up trending arrows coming out of the 2000-2003 bear market. In addition, the same applies coming out of the 2008-09 bear market. Lastly, we see another similar experience coming out of the Covid downturn albeit a bit more jagged upturn when focusing in detail.
By distinct contrast, we see our black arrow clearly down trending coming out of year 2022. In this case, via the line trending down, the Weighted S&P 500 is clearly outperforming the broader Equal Weight S&P 500 which speaks to how narrow the stock market structure has been in this upturn post-2022.
This behavior is a sharp contrast to the traditional and expected behavior of the stock market when moving onward and upward from a rough downturn.
The overall significance of this is it speaks to a narrow market landscape relative to positive investment opportunities presenting themselves. In a broader sense this offers concern relative to what this may lead to.
Traditionally, narrow market landscapes as depicted by our black down arrow can be a precursor to a broader stock market setback.
With this in mind note the behavior of the above chart prior to the red up arrows. As the line weakened and weakened further it walked right into a notable problematic stock market setback. The prior narrowness offered the broad stock market was not performing vibrantly.
Importantly, this offers no timing advantage nor does it offer any certainty that this will lead to an overall market setback. What it is offering is an on-going market landscape that is not operating on all cylinders if you will. When a bull market is not operating at full strength it points to potential developing problems.
As offered, this is not a recent development as our down trend (black arrow) began as soon as the market began its upward ascent coming out of the rough 2022 year.
We can say as soon as that upward move began it continued and then proceeded less than vibrant when viewing the entirety of the stock market structure.
We are watching to see if the broader stock market landscape can improve by broadening out to include more and more stock market listed companies participating in an up trending market. One sign of that occurring will be to see the established black line down trend reverse course and begin to move upward.
This would offer the broader stock market is kicking into gear and would be a much welcomed development when viewing the overall health of our current stock market structure.
For now we continue to observe a wealth of nuances in assisting if we can see that type of broadening and if not whether it will begin to lead to problems for the stock market at large. We will share as time evolves.
I wish you well…
-Ken from Mind Your Stops