

The Stock Market Has Quickly Reverted Back to its Post-2022 Behavior

May 14, 2026
Have you seen what the stock market has done lately?
On a personal note, the above is a question I hear consistently. My knee-jerk response is, “Which stock market?”
Over recent years (post-2022 in particular), we have shared more editions than I can remember on the observation of how the stock market is narrow in its participation.
What this means is of all the companies that comprise the broad stock market, a remarkably low number of them are providing the upside performance that is juicing the well-recognized stock market indices.
Most notable is the traditionally reported S&P 500 index. This often-referenced index is a weighted index, which simply means a few handfuls of companies have an outsized impact on its performance.
Conversely, within the S&P 500 realm, there is the equal-weighted index, which is as its name implies. All 500 companies are given an equal weight in terms of their stock price performance impacting the results of this index.
Hence, in a general sense, the reason for my knee-jerk quip of “Which stock market?”
Our Dow Theory observations
Approximately a month ago we shared an edition speaking to the general stock market backdrop via what is known as Dow Theory. That represented our second look at Dow Theory thus far in 2026.
We shared multiple Dow Theory editions because it had been quite a while since the two component indices of Dow Theory were actually functioning constructively. With this, we shared them as additional perspectives that collective market participants were attempting to actually broaden stock market performance.
Dow Theory offers that if both the Dow Jones Industrial Average and the Dow Jones Transportation Average are both trending upwards, whereby higher highs are attained, then it bodes well for both the stock market as a whole as well as the general economic landscape.
While neither of those indices is screaming a newfound Dow Theory issue current day, to be fair, they certainly are not thriving, in particular when viewed through a comparative lens of select areas that are thriving.
This is the problem with the general stock market landscape, in particular, just in the last few weeks. We have seen a renewed massive outperformance of some areas while the broader market meanders around nearly aimlessly.
With a broader timeline perspective in mind, we can say the behavior of the stock market in just the last few weeks has reemphasized the larger stock market landscape post-2022.
That is, post-2022 the stock market has been consistently narrow in its performance with occasional attempts to broaden in performance, only to then go narrow once again. Rinse and repeat.
Back to our two S&P 500 indices
Relative to the two different S&P 500 constructs, the weighted version is experiencing comparative outperformance to that of the equal-weighted index. This is in light of heavier-weighted companies within the index being in the sweet spot of what is working within the stock market performance backdrop. As shared above, this is very noticeable once again just in the last few weeks.
The Artificial Intelligence (AI) space and areas related to its build-out are the sweet spot of stock market performance. Various companies in line with this space are having an outsized performance impact with the traditionally reported weighted S&P 500 index.
Below let’s take a look at the two different S&P 500 indices.
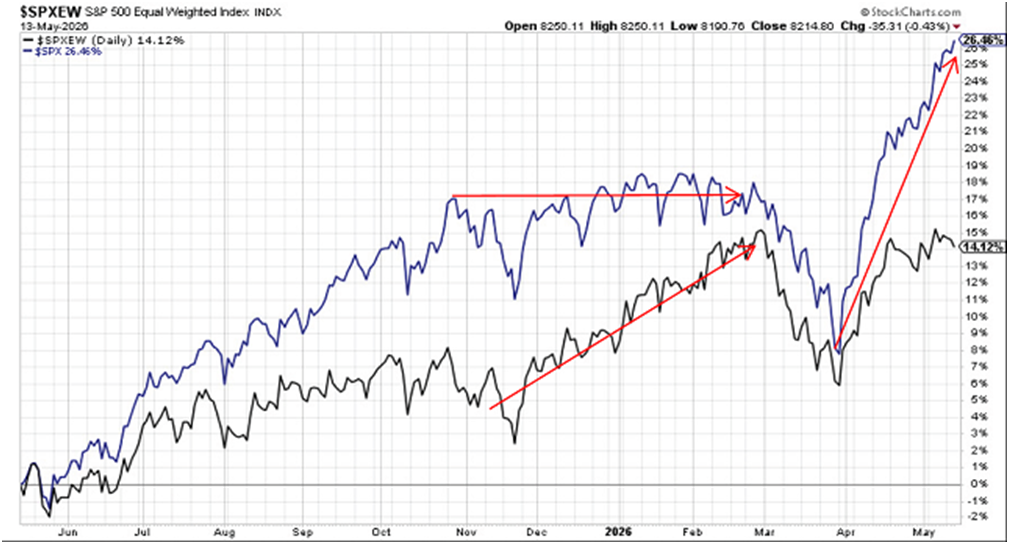
Click For Larger View: https://schrts.co/rCEXRqsW
The above is depicting the performance returns for the previous year of the two different S&P 500 indices. The blue line is the traditionally reported, weighted version of the S&P 500, while the black line is the much less reported, equal-weighted version of the S&P 500.
Mid-chart we highlight the broadening attempt by collective market participants via our red lines. This attempt began in November of last year.
Note how the blue line went relatively dormant (think sideways price action) while the black line began to put in a nice consistent uptrend. Both then headed south in March with a bottoming out at the end of that month.
The real action began as April unfolded in that both were participating in upward performance trends.
Our red arrow highlights how, yet again, the market went narrow in performance as the blue line (the weighted S&P 500) went full rocket ride, leaving the black line (equal-weighted S&P 500) far behind in comparative performance.
While that was unfolding, Dow Theory, for its part, did not collapse but it has gone relatively dormant in conjunction with other areas of the stock market at large. This while the “AI trade” as it is known, has gone straight up all while the broad market has gone quite narrow, yet again.
The problem with narrowly participating market landscapes is they lead to downside problems, given time. A few handfuls of companies, historically speaking, cannot carry stock market performance alone eternally.
We continue to monitor stock market behavior relative to this narrowness issue. Our concern is if it cannot broaden out and display actual healthiness that is analogous to historical bull markets that it will end its run similar to that of which historical narrow market backdrops have ended in the past. Think much lower in price and trend.
For now, the broad stock market is holding its own.
It would go a long way under the banner of structural vibrancy if it could strengthen, similar to the trend the equal-weighted S&P 500 version displayed in our chart above, in the middle of the time depicted. The broader market was beginning to display a healthy trend but faded after just a few months.
We continue to focus on this storyline and will share accordingly through various angles as near-term weeks and months unfold.
I wish you well….
-Ken from Mind Your Stops