

The Man Offered, It Is a "Challenging Situation"

August 27, 2025
Late last week, the annual gathering of various government officials and academics occurred in Jackson Hole, Wyoming. As is customary, the sitting Federal Reserve Chairman is given a timeslot to share overall economic views with the attendees, as well as the media.
This often turns out to be a much-anticipated speech as market participants look for any additional guidance on forward monetary policy. This year’s anticipation was higher than normal in light of expectations of incoming rate cuts. Would any details be offered?
Chairman Powell did offer policy adjustments may be warranted – that is Fed speak offering rate cuts are coming.
As a brief backdrop, it is important to realize the Fed has a dual mandate from Congress in guiding monetary policy. One is price inflation, and two is employment; together they equal the dual mandate. With this, it is customary for the Fed Chairman to discuss both price inflation and employment.
At times this can get quite interesting in that one can be weakening while the other is remaining steadfast, or worse, attempting to increase. This type of setup is a brewing problem when it is price inflation that is chirping at increasing again, while simultaneously, the employment landscape is showing signs of weakening.
Interestingly, we are in this type of developing landscape for the price inflation/employment market interaction of the Fed’s dual mandate.
For our part, in near past editions, we have delved into the price inflation landscape, but it has been since the spring season that we offered any views on the employment backdrop.
Today, with the Fed’s dual mandate in mind, along with a quote (below) from Powell at Jackson Hole, we thought we would share some points of interest that have caught our attention relative to the employment market as recent months have unfolded.
“In the near term, risks to inflation are tilted to the upside, and risks to employment to the downside—a challenging situation. When our goals are in tension like this, our framework calls for us to balance both sides of our dual mandate.”
Speaking to the above excerpt, the typical approach when attempting to balance both sides of their dual mandate is the more problematic side gets the attention. The squeaky wheel always gets the grease right.
In this case, the developing weaker employment backdrop takes priority over a potential continuing-to-increasing price inflation storyline, hence the balance. In addition, hence the “challenging situation.”
If price inflation, to whatever degree, reaccelerates to a further uncomfortable growth level while employment continues to weaken, this would offer a recipe for stagflation.
It could be thought of as “stagflation light,” if you will, whereby economic growth is not too weak but is noticeably on the weaker side, while price inflation is not running hot and yet is also noticeably too high. Weaker growth + higher price inflation = stagflation on the lighter side.
As the chairman offered, a “challenging situation.” Challenging, in particular, if these two items of the dual mandate lean toward a trend as near-term months unfold.
The Employment Landscape
As offered above, there are some points of interest that have caught our attention in recent months. These are not specific to X number of jobs being created per, you name it entity, private or government, but rather they are oriented toward large macro-observations of the employment scene in the U.S.
Below, we will look at two of various observations that we have taken note of in recent months within the employment landscape.
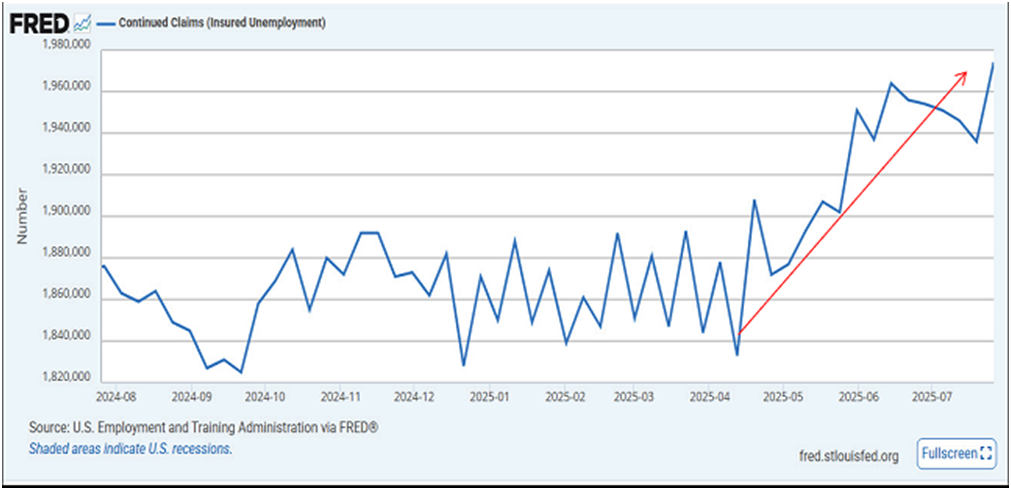
Click for Larger View: https://fred.stlouisfed.org/graph/?g=1Lc1C
Above is a one-year chart of continued claims for insured unemployment. Our red arrow denotes a sizeable and yet consistent uptick in these continued claims since the spring season. We have seen an increase of 135,000 people since the spring season to date. This equates to an 8% increase in the previous few months.
For our part, when sharing unemployment claims, we traditionally look at the initial unemployment claims.
These track how many people are submitting insurance claims for unemployment in light of losing their jobs. We think of it as a tip of the spear for registering if the employment landscape is crumbling. Think current job holders being sent to the sidelines en masse when initial claims pick up notably.
Relative to initial claims, the most recent release reflects 235,000, which is elevated a bit from recent months but is not at a level that is offering a troubling employment market for those already employed.
Continued claims, in our chart above, are a measure that shows if people are having more difficulty finding new jobs, according to the continued claims trend, after they have submitted their initial unemployment insurance claim. The above reflects a breakout trend in recent months.
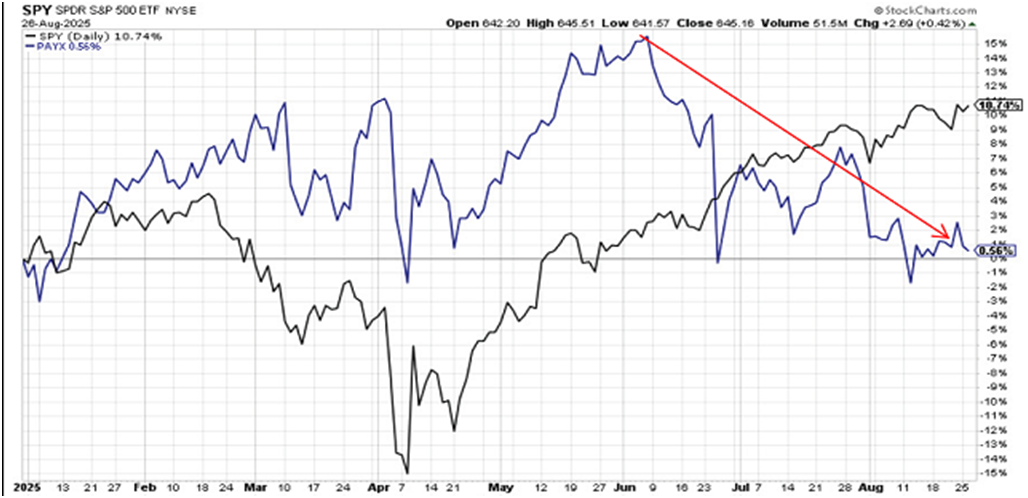
Click for Larger View: https://schrts.co/JNdqvcHx
If applicable, we always like to get the perspective of the collective market participants’ view via the wake they leave behind in their trading operations. When profit or loss is the bottom line of the pursuit, it tends to keep people quite focused relative to that of an easily offered opinion, with little downside if it turns out to be incorrect.
Payroll processors are an applicable group to that of the employment landscape. Paychex, Inc. is a multi-decade publicly traded company within the payroll processing space.
Logic offers collective participants, if they become less than enthusiastic about the employment landscape, shall we say, would cease bidding up shares of payroll processors. We are using Paychex as a representation and as a tool for this insight, not as an investment view on Paychex itself.
Above is a year-to-date returns chart for Paychex (blue line) along with the S&P 500 index (black line) as a benchmark reference point for the stock market at large.
Placing the two together offers a view of whether participants are bidding up Paychex shares in an outperforming manner to the stock market at large or whether they are underperforming.
An overall view of the above chart clearly reflects a strong outperformance by Paychex compared to that of the S&P 500 in 2025. Reflecting this strength, earlier in the year when the stock market went down hard negative, Paychex shares had barely touched a negative year-to-date performance. Impressive.
That was then, and this is now, as they say. Our red arrow denotes the hard downtrend of these shares from a strong outperformer to a notable underperformer, relative to that of the stock market, in the previous couple of months.
Like our continued claims shown above, initial claims (not shown), and the above payroll processor, we are not seeing an employment market that is rapidly crumbling. Rather, we are seeing an employment market that is showing some weakening on the vine, if you will. Think early trend behavior.
The Fed, as shared above, is balancing their dual mandate at a time when the two mandates are chirping at heading in opposite directions – a “challenging situation” – to quote the Chairman once again.
Expect Fed rate cuts coming down the pike.
As shared in previous editions, this does not assure interest rates across the board will chime in with the Federal Reserve’s interest rate cuts.
Treasury bond participants are in charge of that storyline, and the last thing they like seeing is a questionable price inflation backdrop, in particular when interest rates are being reduced simultaneously.
As shared at the near outset of this edition, this could get quite interesting as the Fed is attempting to balance their dual mandate, which is analogous, at times like these, to serving two masters while both are leaning toward opposite directions.
As the calendar pushes toward the fall season, there will be a wealth of related interactions of this overall storyline as the weeks unfold. It will be interesting as this socioeconomic backdrop plays out. We will share on these accordingly.
I wish you well…
-Ken from Mind Your Stops