

The Bond Market is not waiting on the Fed

June 3, 2026
In our previous edition we focused on the 10-year benchmark treasury note and how bond market participants have pushed up its interest rate in recent months, as well as recent years, to the 4 ½ percent area. We are calling that too close for comfort relative to the psychologically important 5% level – a level that would be a new 20-year high if attained.
The 10-year treasury note is viewed as part of the long-end of the maturity spectrum for treasuries.
We looked at the long end and its stickiness to hold at high-interest-rate levels through the lens of price inflation, as well as the endless massive government deficit spending.
If we look at the shorter end of the treasury maturity spectrum, we see those same bond market participants are not waiting on the Fed to raise short-term interest rates in light of the increasing price inflation trend. Participants have been pushing up short-term rates in recent months.
The Fed is getting behind the price inflation trend again, which, if continues, will reassert their overall monetary policy approach of this 21st century that is vastly different from the decades previous to the early 2000s.
Below we take a look at the long-term picture of the Fed’s short-term interest measure, known as the Fed Funds Rate, alongside price inflation via the Consumer Price Index.
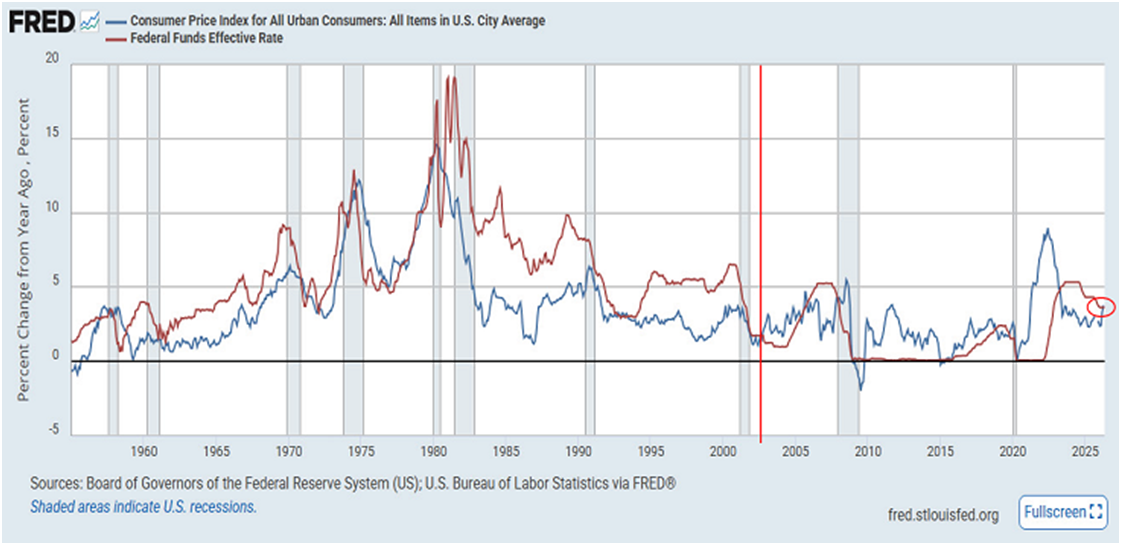
Click For a Larger View: https://fred.stlouisfed.org/graph/?g=1WKnX
The above dates back to the mid-1950s for a broad perspective.
The blue line represents the Consumer Price Index (CPI), while the red line denotes the Fed’s short-term interest rate.
We have inserted a thin red vertical line within the chart to offer a visual compare-and-contrast perspective.
Note the relationship of the two lines in the decades preceding the early 2000s. Back then, the Fed’s short-term interest rate tool was kept consistently above the rate of price inflation. That is, the red line was consistently above the blue line.
To the right of our red vertical line, this relationship changed to the point whereby the Fed kept its short-term interest rate below the rate of price inflation. As a general observation, the red line has been kept consistently below the blue line as the 21st century unfolded in light of this policy approach by the Fed.
To the far right of the chart, we see that in the last three years the Fed has reverted back to keeping their short-term interest rate above the level of price inflation.
We had asked in a distant past edition whether the Fed would revert back to this type of monetary relationship relative to price inflation. Time would tell the story as we offered it in the past.
As we stand today, via our small red circle to the far right, we see that price inflation is now beginning to rise above the Fed’s short-term interest rate.
Is the Fed reverting back to its now-established 21st-century monetary policy?
When the Fed’s short-term interest rate is held below the rate of price inflation, it is considered an easy money approach. More formally, it is known as negative real rates, as the Fed’s interest rate is below the growth rate of price inflation.
As a general statement, this invites notable speculation in the broad economic system when this approach is used as a go-to. Welcome to the 21st century storyline. Speculative fervor has run rampant throughout numerous markets.
As a side note supporting this view, the stock market, as one market example, is now hovering at the highest valuation level seen dating back to 1870 – not a typo. This is proven via the CAPE ratio, which is the cyclically adjusted p/e ratio; this is also known as the Shiller p/e ratio.
As a reference point, the previous high point was in late 1999.
You could say the AI bubble is introducing itself to the former Dot-Com bubble. The first one ended badly. How will this second one end?
You know how it will end. It will end like all bubbles end. They float around searching for a pin, and then upon discovery, they go bye-bye quickly. We digress.
As stated previously, bond market participants are not waiting on the Fed to raise short-term interest rates. Below, we share the trending higher short-term interest rates.
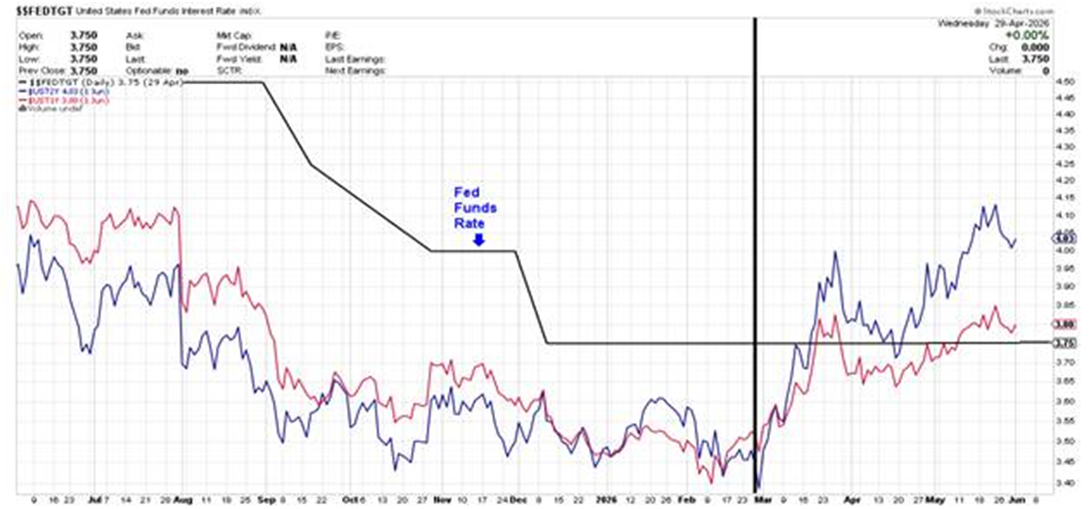
Click For a Larger View: https://schrts.co/EgmsTrJF
The above encompasses the previous year. For reference, the gradually descending black line represents the Fed’s short-term interest rate as noted with our blue arrow.
The red line denotes the 1-year treasury bill, while the blue line identifies the 2-year treasury note.
We have added a black vertical line as a reference point in comparing and contrasting the behavior of bond market participants toward these short-term treasury instruments.
Via the chart, bond market participants have been consistent in pushing up the interest rates of these short-term treasuries. For their part, they are not waiting on the Fed to increase rates.
If they continue as near-term weeks and months unfold, the Fed will respond by chiming in with the collective bond market participants.
Bond market participants, as a general statement across the treasury maturity spectrum, have not been seeing eye-to-eye with the Fed, if you will, in recent years. This is particularly true the longer you go out on the treasury maturity spectrum.
Bond market participants are ever less impressed with the price inflation backdrop and the deficit spending landscape, think monetary and fiscal policies out of D.C. officialdom in recent years.
This may prove to be problematic for many markets that are filled with speculative fervor, based on easy money and fiscal policies, if bond market participants continue with their ways of pushing rates upward.
Speaking to our first chart, the Fed may not be able to carry out the easy money policies of negative real interest rates that became a bit customary in this 21st century without a bond market revolt. Such a revolt would involve higher interest rates throughout the treasury maturity spectrum.
This type of storyline would be quite a challenge for various markets that are bubbled up to epic valuation levels.
Without easy Fed and fiscal policies, those valuation levels certainly would struggle to hold at such high levels. Price inflation and bond market participants are central players in all markets at this juncture as we look forward.
The above overall storyline should prove to be quite interesting as 2026 unfolds to its conclusion.
I wish you well….
-Ken from Mind Your Stops