

Taking Stock of the Stock Market

January 15, 2026
Collective stock market participants are putting a different market landscape together in recent weeks relative to what we had grown accustomed to in recent years.
To be fair, this developing change can disappear quickly, which has also occurred in recent years.
We have dedicated many editions over the last few years to our observation of the structural weakness within the stock market. If the stock market were an eight- cylinder engine, we would describe it as operating on five cylinders, at best, in recent years.
The headline performance of the stock market has been dominated by relatively few companies when viewed across the entire landscape of offerings throughout the market.
This type of market backdrop is succinctly described as a structurally narrow market. Conversely, when the performance of the market is supported by many, if not most of the companies comprising the stock market, it is labeled as a structurally broad and sound market.
Narrow markets are viewed as suspicious and, if you will, untrustworthy by participants in light of the lack of broad strength throughout the market backdrop. When a bull market is trending in a narrow sense, it can portend problems, given time.
We have shared this curious storyline of the market’s structural health, or lack thereof, as the bull market reasserted itself after the notable downturn in 2022. To underline this overall storyline with a historical context, below we offer a chart that was often shared within editions since that time period.
Click For Larger View: https://schrts.co/PvRBmRBe
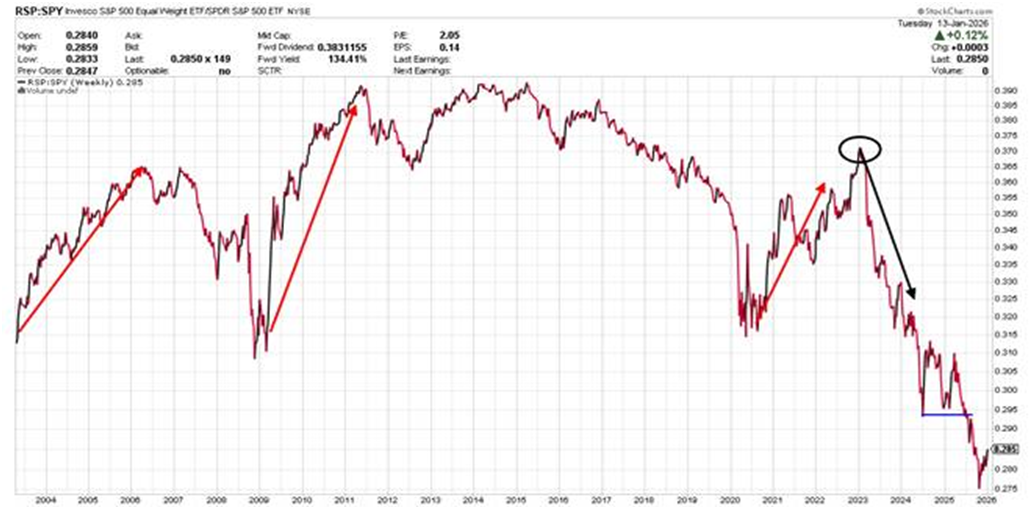
The above encompasses this 21st century whereby it places the performance of the equal-weight and weighted S&P 500 indices against one another. When the line above is trending upward, this means the equal-weight S&P 500 index is outperforming the weighted S&P 500 index.
In the equal-weight version, the index performance is a result of how the 500 companies’ stock prices performed in total.
The weighted version, which is the version that is always reported on by media, places more weight on certain companies relative to other companies according to how the index is constructed. With this, a few handfuls of companies have an outsized impact on the performance of the weighted index.
Our red arrows within the chart point to the strong outperformance of the equal-weight version coming out of notable downturns (bear markets) in this 21st century.
Our black arrow, post-2022’s notable downturn, highlights the historical aberration of this bull market, as the weighted version has handily and consistently outperformed the equal-weight version.
Since that timeframe the weighted version has doubled the performance of the equal-weight version in percentage return results. 78% compared to 35%. That is notable atypical behavior for fresh bull market time periods.
Historically, we are accustomed to broad and robust strength across the stock market landscape when coming out of a bear market downturn. Our black arrow, pointing to the long downtrend, highlights how structurally narrow the stock market has been in recent years.
In the lower, far right corner, we see an uptick developing in recent weeks. This may only be yet another attempt at the market broadening out only to be turned back again, such as we have seen numerous times in the path of the highlighted downtrend within the chart.
As we often say, no trend goes up or down in a straight line, which is again affirmed in the above downtrend.
Below, let’s isolate recent weeks through a completely different view with an additional component added to the mix.
Click For Larger View: https://schrts.co/JKMfWymt
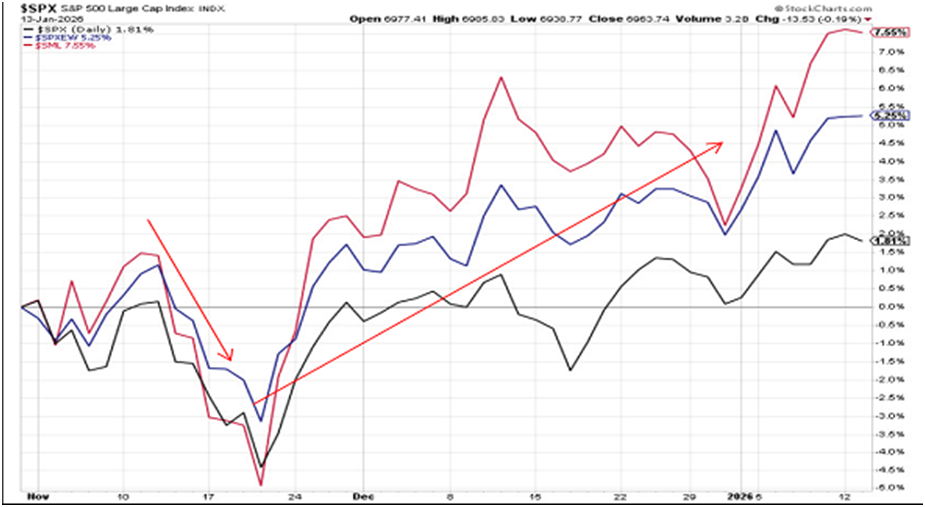
The above dates back to the beginning of November in order to provide some recent perspective. The black line is the weighted S&P 500, while the blue line is the equal-weight S&P 500. Our new entrant to the mix is depicted by the red line, which is the S&P 600 small company index.
All three lines are reflecting their percentage performance process since the beginning of November.
Take note toward the left side of the chart in the mid-November timeframe. Our red down arrow highlights how all three incurred notable air pockets that ultimately led to a resumption of the trend as November proceeded into December. Our red up arrow highlights the resumption of the trend.
Most importantly, our red up arrow also points toward a behavioral shift.
Note how the S&P 500 weighted index (black line) began to struggle in performance, in particular when compared to the other two as we moved into December. The equal-weight S&P (blue line) began to easily separate itself from the weighted version, as did the small company S&P 600 (red line) index.
As late 2025 morphed into early 2026, the behavioral shift that showed its first signs of life in the latter part of November continued to build in strength. Behaviorally speaking, in recent weeks the broader market has begun to perk up, especially relative to the more narrow, weighted S&P 500.
We added the small company S&P 600 index to the mix above for emphasis of said behavior.
The small company indices have been quite poor in their performance relative to the weighted S&P 500 index in recent years. In this case the S&P 500 weighted index tripled the performance of the S&P 600 small company index from 2023 through year-end 2025. 78% compared to 26%.
As an additional note relative to the atypical behavior of this post-2022 bull market run, small companies customarily lead the charge higher coming out of a bear market experience. In this case, as shared, small company stock price performance has been abysmal relative to the weighted S&P 500 index.
For the small companies via the S&P 600 small company index to show leadership in performance underlines the above behavioral shift of late.
As offered above, this developing shift can disappear quickly, as we have seen attempts at broadening behavior several times in recent years that ultimately fizzled out. For the small company indices to also show leadership offers additional credence to this current shift.
It is crucial to know the general behavioral tone of the market landscape when deploying capital. In a general sense, it keeps deployed capital from swimming upstream, if you will.
Collective stock market participants have been pricing in a change in the structural landscape of the market in recent weeks, which began to catch our attention as we came out of the mid-November air pocket as depicted above.
Now the central question and observation point is to monitor if this shift can stick and have lasting trend tendencies. We will update and share accordingly as the near term unfolds.
I wish you well……
-Ken from Mind Your Stops