

Participants are Suddenly Less Selective

July 8, 2025
By the afternoon of our last publication, market participants began to show some change in their collective behavior relative to the stock market. That date was June 26th, which for us was a “mark the calendar” type of day.
We often do this when any type of notable behavioral change takes place in X market. In part, this allows for tracking to that specific day, if not hour, as the timeline rolls on. Think of it as a mini-market-based diary, if you will. The central objective is to closely monitor said behavioral change as near-term days and weeks unfold.
Is said change a mere blip, or will it prove to be substantive. This is always our central observation point.
At times, many times, it turns out to be a shot across the bow type behavioral change that goes away as fast as it appeared.
Interestingly, as we have seen unfold many times, that shot across the bow didn’t go away but rather went dormant for X weeks in some cases. Then, yet again, out of nowhere, it reappears again in an even more substantive way.
In those cases it is as though collective participants are offering a cunning change in behavior with some level of uncertainty, compared to a more robust, blatant, notable change.
The change we had seen on June 26th, which, to be fair, said participants had offered a subtle behavioral “chirp”-type change a couple of days prior, has thus far shown itself as a more robust type of behavioral change via upward-pressing stock prices.
Importantly, this is more than the price of X index being bid higher by participants.
Rather, far more important than that type of isolated storyline, this change in behavior we are focusing on is about the broadening out of areas of the stock market that participants had shown a lethargic interest in bidding higher.
The selectivity that we have noted throughout various editions for the bulk of 2025 is turning into something that we would expect to see when the stock market is truly healthy and vibrant.
In order to keep this edition relatively succinct, we will not recap the various angles of past editions that pointed to the selectivity participants were displaying via their stock market operations, but we will offer many of those observation points, to include many other market-based observations we had not shared, have chimed in on this improved behavioral change.
Participants are bidding up much larger swaths of the stock market landscape, which, prior to June 26th, they had displayed a general disinterest in doing so in any meaningful way.
Will this lead to what we consider a “true” bull market?
That is, a market landscape where there is a plethora of upward-trending sectors, sub-industries, and market capitalization plays, to include broad-based, equally weighted indices that perform with, if not even better than, their weighted, more specialized stock market indices.
This is to be determined, but the sudden and robust change in the healthy bidding up and broadening out of far more areas of the stock market offers a degree of confidence in a developing true bull market.
For this to actually occur, we need to see upward trending prices across a large swath of market indices, sectors, and industries where they are putting in a series of higher highs.
We are not there currently, as many areas have yet to reach their previous high points, let alone put in a series of higher highs. With this said, as offered, there is a behavioral change from collective participants that is noteworthy.
The Dow Jones Industrial Average
Below we show one aspect of collective market participant’s behavioral change via the Dow Jones Industrial Average.
It is important to note this bellwether index has been lagging in its performance like so many other areas of the stock market, and in the Dow’s case, it is one area we had pointed to in a somewhat recent edition where we used Dow Theory to underline the selectivity of market participants at that time.
The Dow just couldn’t kick into gear, so to speak. Ditto that for its sibling, the Dow Jones Transportation Average. That has changed for both. We will focus on the Industrial Average.
In order to offer a visual that depicts the rapid behavioral change of participants, we thought we would offer a before-and-after view of the Dow. With this, we stacked two charts of the Dow to offer a compare-and-contrast view.
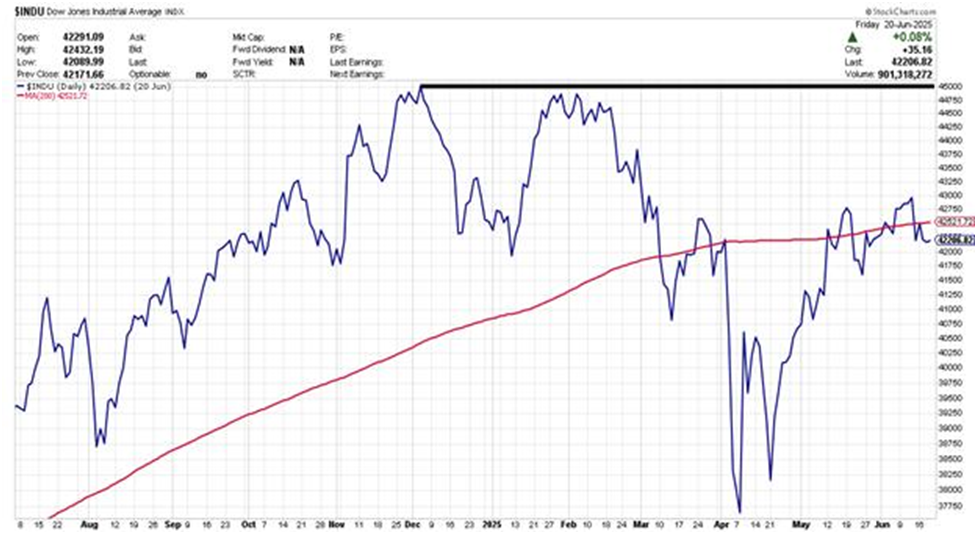
Our first chart below represents the Dow closing out the week of June 20th. Its pricing and trend attempts were lethargic. We placed a black horizontal line at the previous high point to underline just how far away it was from its previous high and, with this, how much it had been struggling to perform.
Visually underlining the Dow’s struggle, we included a 200-day moving average line (red line in the chart) to show how it could not get above, and hold, its 200-price average. If a market vehicle cannot hold above the average price of the previous 200 trading sessions it is safe to say the vehicle in question is certainly struggling on a trend basis.
Our second Dow chart is set up exactly as the first chart described below. The following week, the week encompassing June 26th, we see a vastly different picture offering a notable behavioral change from market participants in pricing the Dow Jones Industrial Average, which includes up to the 4th of July holiday.
The previous high point (black horizontal line) has all but been attained quite rapidly. This depicts a robust behavioral change from collective market participants.
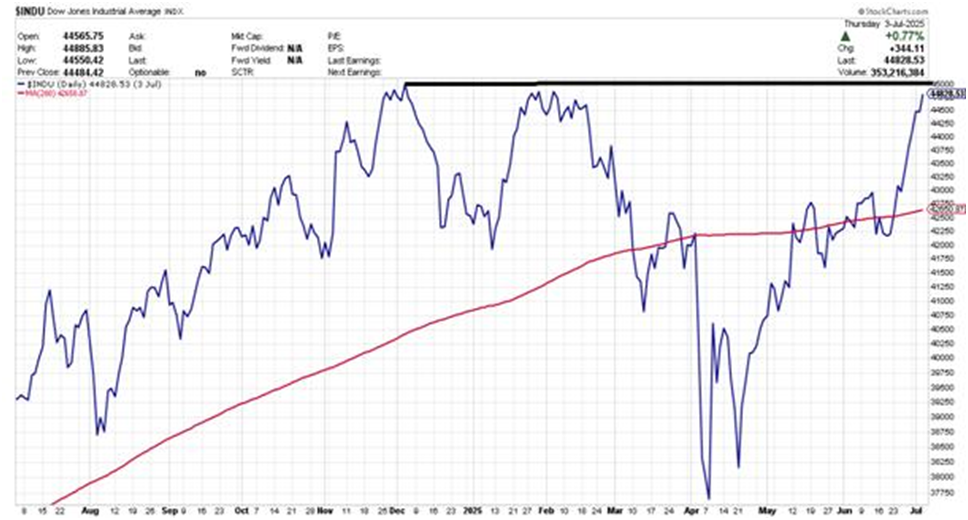
Click For Larger View: https://schrts.co/tiyXAqpk
What makes the above storyline quite impressive is the corroboration of other areas of the stock market.
Some have performed better than the above views, while others have performed less than. The important change in behavior is emphasized via the inclusion in performance from areas that have either been dormant or have reluctantly moved higher in recent months, such as the Dow Industrials itself.
While the Dow has certainly been off its 2025 lows, it has been challenged in its trend attempt until the last week of June.
Other areas of note that historically are always quite healthy in true bull markets have put in strong moves as well. The equal-weight S&P 500 index has also quickly kicked into gear to also attain its previous high point.
The small-sized company index known as the Russell 2000, which has been sorely lacking in performance over recent years, has also chimed in, albeit to a lesser extent. We could offer other examples, but you get the point.
Market participants have quickly bid up areas of the stock market which they had been reluctant to do until the last week of June. Will this continue as the coming weeks and months unfold?
The strength and power of this behavioral change offer an increased level of confidence that this will have some staying power.
The central question, as these indices hit their previous high levels, is can they continue to power through to post higher highs which will be the ultimate testimony by collective participants that they are indeed willing to bid this stock market landscape into a true bull market.
One test will be the above chart of the Dow itself.
Can that black line be exceeded with prices trending higher from there in coming days and weeks? This is worth paying close attention to as a simple way to monitor this broadening stock market storyline.
I wish you well…
-Ken from Mind Your Stops