

Moving Pictures - Stock Market Style

February 4, 2026
In our first edition for 2026, we addressed the stock market generally while specifically focusing on the broadening out of the market landscape.
Within that edition, as well as strewn throughout many editions in recent years, we addressed how the stock market, if it were an 8-cylinder engine, could be described as operating on 3 cylinders.
Simply, it was functioning (think bull market), but it could hardly be described as a rock-solid bull market with broad participation whereby large swaths of companies were charging higher on strong trends.
Rather, a few handfuls of companies, dominated by technology names, were roaring higher, which in turn made well-recognized indices, such as the weighted S&P 500, appear as though the stock market as a whole was strong and vibrant, if not on a roaring uptrend.
In the opening edition for 2026, we offered collective market participants were signaling a rotation attempt that was evolving to look like a stock market that was broadening out. Broader stock market landscapes, whereby large swaths of companies participate in healthy trends, are far more structurally healthy market environments.
The problem is, using history as a guide, when entrenched stock market leadership starts to take a backseat to other areas of the market (think rotation), the process often brings with it volatility for the market as a whole.
While it can be a positive development, that is, in this case, a broadening storyline, it can be a precarious process that brings downside volatility for the overall stock market. Succinctly stated, leadership, historically speaking, dies hard.
Back to our opening 2026 edition, within it we used three S&P indices to visually share what has been unfolding since early November.
Today, we will home in more specifically to the technology space along with two other areas that represent the broadening theme. As an aside, there are many ways to visually share the described rotation attempt, so below is certainly not the only way to do so.
Hence, why in our first edition of 2026, we took the approach we did at that time, and now in this edition, we are using a couple of different vehicles to address said rotation attempt.
Context is Important
Click Link For Larger View: https://schrts.co/GwyrzcRs
We have shared endlessly that post-2022, and its notable stock market downturn, that the fresh bull market acted as a historical aberration. Simply, as described above, it was lacking in broad participation. Think of an 8-cylinder engine operating on 3 cylinders.
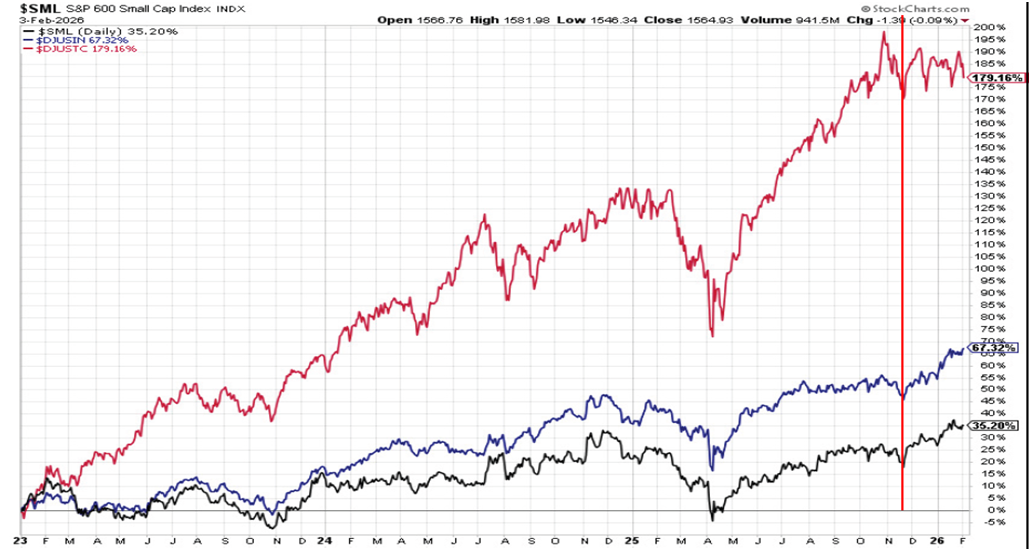
The above performance chart depicts part of this storyline as it dates back to the beginning of 2023 up through the current day.
The three vehicles we are using to depict the narrow stock market landscape of recent years are the Dow Jones Technology Index (red line), the Dow Jones Industrial Index (blue line), and the S&P 600 small company index (black line.)
As an important aside, the aforementioned blue line, the Dow Jones Industrial Index, should not be confused with the well-recognized Dow Jones Industrial Average.
The Industrial Index above encompasses more industrially oriented companies.
Let the chart speak for itself. Note the tremendous outperformance of the technology index (red line) relative to the other two vehicles. It outpaced the Industrial Index by a factor of three while outpacing the small company index by a factor of five.
Clearly, as offered, stock market leadership post-2022 has been technology hands down!
Also as offered, collective market participants are offering a change attempt, or think, an attempt at rotating to a broader market environment.
If you take an additional peek at the above chart and look to the far right of each vehicle via the red vertical line we inserted, you can see the rotation attempt unfolding as the November downturn quickly evolved into rotation and an attempt at new leadership. Note the blue and black lines trended upwards, while the red line has struggled sideways-to-down.
Will this rotation attempt stick?
This is the central question and observation point that we shared in our first edition for 2026, which we continue to ask and monitor closely as we have moved into the second month of 2026.
Things are getting a little squirrelly in recent times as the technology space continues to lose a bit of its luster, and in so doing, speaking to our central concern, it is attempting to put a chink in the process of rotation to a broader market environment.
Let’s now home in on this storyline in recent months.
Click For Larger View: https://schrts.co/njCsjYmN
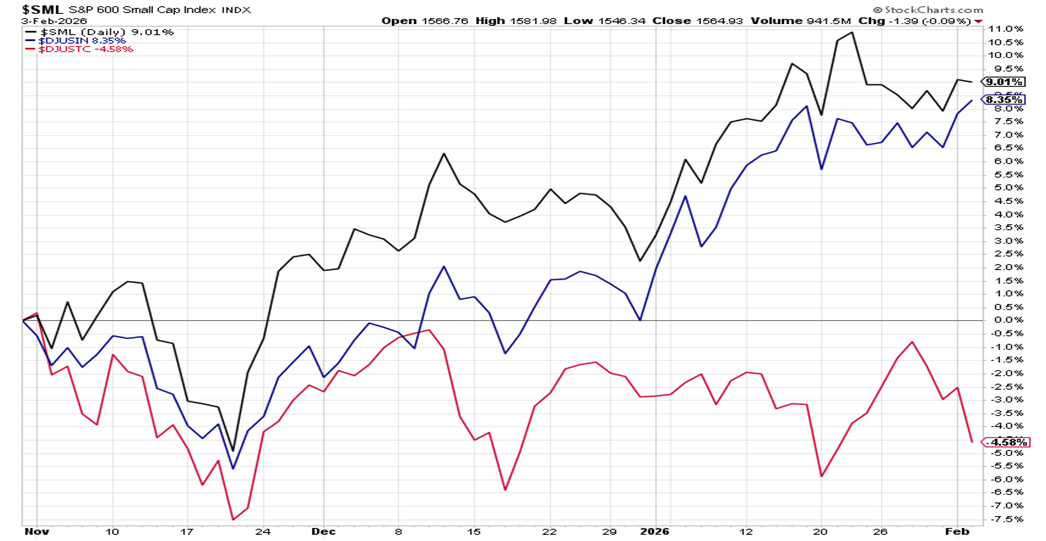
Above are the same three vehicles as in our first chart, with the color themes continued. Our chart is quite condensed on the timeline relative to our first multi-year chart. Above is November 2025 through the current day, as of this writing.
Note the tremendous change in behavior of recent months. The technology index, the red line, has been consistently struggling in performance, with it registering a negative 4.5% return since November 1st.
For the venerable technology space of recent years, a three-month run of negative performance seems nearly impossible. In particular, if you read headlines up to the current day. As is often the case, headlines and reality can many times be miles apart.
On the broadening front, note the tremendous outperformance of the previously lackluster areas of the industrial space and the small company index shared in our first chart. Since November 1st, they have been trouncing the technology space in behavior and performance.
While technology is posting losses since November 1st, the industrial and small company spaces are posting 9% (rounded) positive performance. This is unheard of behavior relative to recent years.
Will it stick?
Yes, we continue to ask as this as this is our central question and observation point.
We emphasize, through redundancy, that rotation, historically speaking, typically brings with it downside volatility for the overall market.
Technology stocks are getting more and more concerning in their performance behavior, including in recent days. If this continues into a downside trend for the technology space, this will clearly show their leadership within the stock market performance landscape is turning over.
If so, what will that look like for the broadening market storyline of recent weeks and months?
For our part, we are watching this process closely and continue to chronicle the process here in these editions. In our view, relative to the stock market, it is the central observation point at this juncture on the timeline and speaks volumes to asset allocation within the stock market. We will continue to share accordingly.
I wish you well….
-Ken from Mind Your Stops