

Let's Wrap-up 2025 with a Socioeconomic View of the Stock Market

December 18, 2025
Today’s edition will wrap up our 2025 offerings as the calendar is barreling toward the end-of-year holidays. We will continue sharing perspectives and observations on the socioeconomic landscape in the front part of January.
In recent editions we have addressed the stock market and the housing market through different perspectives. Regarding the stock market, we have shared views of the behavior of collective stock market participants as well as valuation levels.
What about the behavior of the general citizenry relative to the stock market? Can we gauge that?
Similar to looking at collective participants and observing messaging left in the wake of their market operations, we can take a long-view perspective to see how the citizenry is viewing the stock market relative to broad financial assets.
Through the lens of valuation levels for the stock market, are they doing what they typically do, using history as a guide, whereby they can’t seem to get enough of stock ownership, as the stock market is epically expensive when observing it through any valuation measure?
As we have shared many times, price itself informs little about an asset, but valuation tells all.
Interestingly, casual market participants and seemingly hardened, deeply experienced participants are drawn evermore to markets when seeing/hearing that prices are rising higher and higher.
When said prices have risen to such a level that “bubble” is an appropriate descriptive word to use as a label for the general market landscape, the attraction nears trance-like levels. This state of mind is counterintuitive.
When in a bubble, people are quite enthusiastic about the stock market, as told by their asset positioning, while they should be far more concerned about the risk in the stock market. Rational thinking can break the bubble psychology trance, which is far more immersed in emotion than it is in logic.
Offer the word “valuation” in an attempt to break said trance-like state, and you get about as much focused attention in return as you do from a beloved dog who is completely focused on that squirrel just twenty yards away. “Yeah, whatever, I’m about to have a treat honoring my pre-domesticated lineage!”
At times, those animal spirits displayed by said dog also apply to humans, identified by characteristics and behavioral attributes displayed within market landscapes.
“Animal spirits” is a descriptive phrase used occasionally to describe the influence human emotions can and do have on market trends.
Animal spirits are running wild and free when prices rise and rise to the point of bubbling. Enter some rational thinking into such an emotional backdrop, and usually the offered thoughts will be received about as sincerely as our aforementioned dog. “Say what? Yeah, okay, whatever.”
Please don’t enter rational inputs while we are collectively lathered up on (emotional) bubble psychology, certainly is an applicable reply.
Regarding bubble market backdrops, below we share two data views that show stock market valuations are off the charts, and as is customary in such backdrops, households, generally speaking, cannot seem to get enough exposure to this financial asset class.
Perfect, collective bubble psychology is displayed as the market bubbles, and enthusiasm builds, rather than a logical response of increased concern toward downside risk coinciding with said bubble.
Click For a Larger View: https://fred.stlouisfed.org/graph/?g=1OSSy
Above we have two charts to use interactively for this edition. Both charts offer significant historical perspective, which gives us a long view of time.
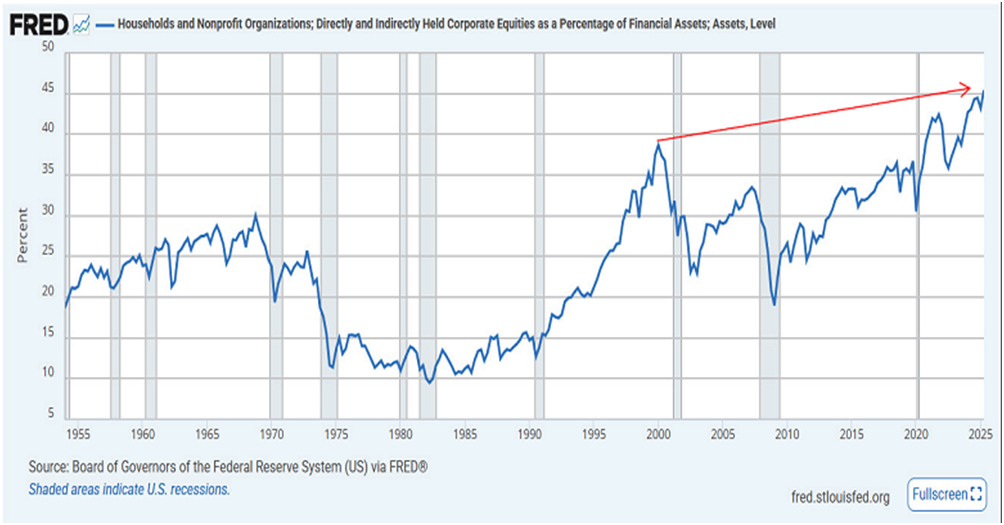
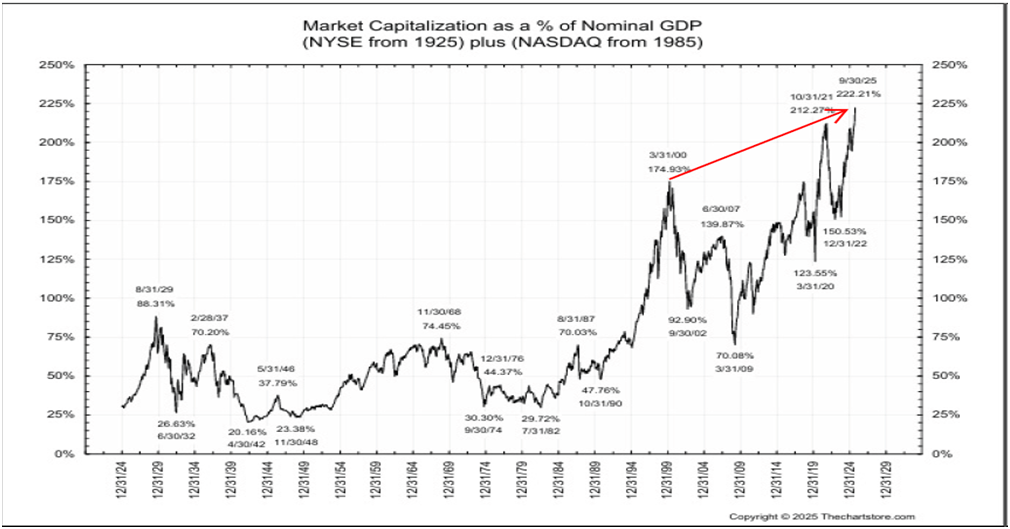
The top chart depicts the percentage of financial assets that households have exposed to corporate equities. The bottom chart is a large macro metric that offers a valuation view of the stock market.
The bottom chart takes the total value of the stock market (known as market capitalization) and compares it to the size of economic activity using nominal GDP as the economic activity gauge.
Via the top chart, the current exposure to corporate equities, as a percentage of financial assets, is the highest we have seen throughout the numerous decades depicted. Our red arrow begins at the prior peak level of exposure dating back to the beginning of this current century, circa 2000.
Let’s call that the flameout level of the tremendous increase in exposure through the dot-com bubble era.
Our red arrow highlights the notable increase in the current household exposure relative to that bubble peak.
The bottom chart is offering an astounding increase in valuation levels via stock market pricing relative to the underlying size of economic activity.
For perspective, the beginning point of our red arrow (bottom chart) was epically high, to that point in time, dating back to 1924. At the dot-com peak, the stock market was valued at an unfathomable 175% of the size of underlying economic activity.
For my part, in real time back then, using the above metric, I thought it was so incredible that we would not possibly see such a level reached again, at least in my lifetime. I was seriously wrong.
Our current reading with a touch of rounding comes in at 225%. This informs us that the current stock market capitalization is more than 2x the size of the underlying economic activity that ultimately supports the sales and profits of the companies listed within the stock market.
With this, as should be expected when in a bubble, the top chart shows that household exposure to corporate equities is also off the charts, relative to its history.
The total price of the market (market capitalization) has been rising and rising, and with this, the collective citizenry can easily get lulled into looking at stocks, not as risk assets, but rather as a vehicle that is analogous to a savings account.
Think: no risk, only upside. Also think of perfect collective bubble psychology in full display.
We offer, yet again, that when discussing market valuation levels, regardless of how historically high they may be, their use as a market timing tool is nearly worthless.
This is why we are obsessed with broad market characteristics and behaviors that aid in gauging whether collective participants are getting concerned about this epically valued market landscape.
For our part, in managing assets in a bubbled-up market environment, it all begins with a sound awareness that we are in a bubble environment and keeping logical, rational thinking and observing at the forefront of our minds. There is no room for trance-like, bubble psychological states of mind when participating in our current valuation backdrop.
Using history as a guide, imploding bubble markets ultimately come for everybody once they begin to pop.
Those who are unaware that a bubble even exists, perhaps because they are oblivious to valuation measures relative to history or because they simply choose to psychologically ignore valuation measures, are setting themselves up for a notable downside experience via their capital.
History does not repeat, but it often rhymes. It will be interesting, given time, how this bubble rhymes relative to previous bubbles that found their pin.
Here is to wishing you a Merry Christmas and a Happy New Year! Thank you for your time in reading these editions – we’ll see you in 2026!
I wish you well…
-Ken from Mind Your Stops