

"In Line" Continues to be Viewed as "All is Good"
January 22, 2025

We have shared in a previous edition how consensus expectations heading into X economic related release can be viewed as, “all is good” as long as consensus expectations have been met, or even better, exceeded. This is particularly true relating to price inflation releases.
The reporting on price inflation releases have reached the comical level at times in terms of how they are reported relative to the actual underlying reality.
Here if expectations are met reporting morphs into not only is it all good again but leans toward the point of offering there is no price inflation issue any longer.
On a personal note I have been paying closer attention to reporting around price inflation data in light of the blatant narrative work that seemingly is being put in as recent data results have been released to the public.
Last week the Consumer Price Index (CPI) and its universe of sub-components had been updated and released. Consistent with our narrative observation it was not unusual to see phrases such as, “Fresh data showed U.S. inflation to be slowing again.”
Reading or hearing a message like this can easily be interpreted as though price inflation is a non-issue. In addition, I seen one well known Wall Street oriented outlet offer that market participants have “overtraded” the inflation story and should stop being so risk-averse. Risk-averse?
We could open up a plethora of avenues taking that description of markets to task. Labeling market behaviors as “risk-averse” would be similar to offering that the proverbial drunken sailor needs to stop being so conservative and to begin to tip back some alcohol.
The socioeconomic reality remains that we have a persistent price inflation issue that is refusing to go away.
The Fed has offered ad nauseam that they will bring price inflation down to their 2% target level come hell or high water.
Interestingly, via their initial foray into a new rate cutting cycle circa September 18th, 2024, they have proven unwilling to experience the “hell” or the “high water” of remaining disciplined relative to their ad nauseam messaging of their 2% target objective dating three-plus years old now.
The Fresh Data
Click For Larger View: https://fred.stlouisfed.org/graph/?g=1D46w
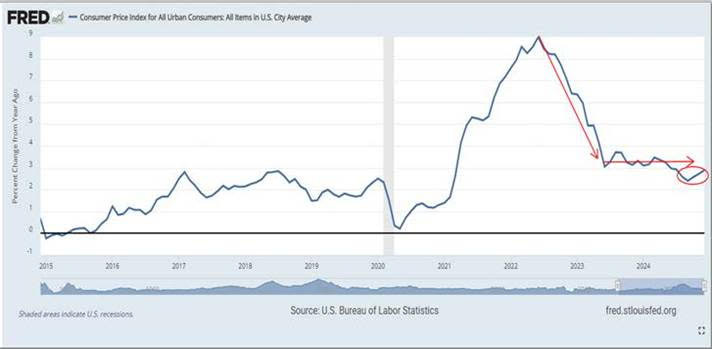
As offered last week CPI data was updated and released to the public. Above is the well recognized Consumer Price Index (CPI) on a year-over-year growth basis for the previous decade for some perspective.
Our red down arrow denotes the notable downtrend in the growth rate of prices, not the decline in prices, as is inferred in some reporting of the data.
Our red horizontal arrow depicts the stubbornness of the price inflation growth rate and the halting of the aforementioned down trending behavior. This red horizontal arrow highlights a consistent growth rate in the low 3% area – far north of the Fed’s 2% target.
Lastly our small red circle identifies the behavior of the last several releases.
After a break lower from the range depicted with our horizontal arrow, prices, on a year-over-year growth basis, have begun to trend upward again. The most recent release offered CPI increased by 2.9%.
This is far from the Fed’s 2% target and is trending in the wrong direction.
Enter the Core Data
Click For Larger View: https://fred.stlouisfed.org/graph/?g=1D47j
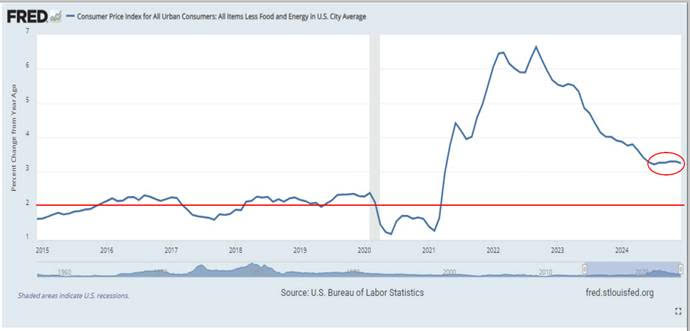
Part of the CPI’s universe of releases includes what is known as the “Core CPI” release. This is the CPI basket with Food and Energy stripped out and is shared above depicting the previous decade for perspective.
Food and Energy are more volatile in their price behaviors and at times these behaviors can make the CPI basket look worse than the general pricing landscape actually is and at other times better than the pricing landscape actually is.
With these two components removed Core CPI is meant to be a measure of what the underlying price inflation behavior is without the more noisy components involved.
For its part Core CPI continues to offer a problematic and stubborn price inflation backdrop.
Our small red circle encompasses current day back to June 2024.
As displayed we can see the growth rate is remaining consistently north of 3% coming in at 3.2% to be precise. This growth rate is stuck north of 3% which is a far cry from the Fed’s 2% stated target. Our red horizontal line denotes the 2% level for perspective relative to our red circled 3% range.
Viewing the two CPI metrics together we can see price inflation is not over and remains stubborn in its stickiness.
This Offers More Evidence the Fed has Room to Move Rates Lower?
As shared at the outset of this edition, per the general reporting of the above data points we seemingly do not have a price inflation issue in light of these data releases meeting consensus expectations.
As we have shared via the CPI data price inflation has been trending upward over the previous three releases while for its part the Core CPI measure remains stuck in the low 3% growth range.
Neither of the above offers an improving storyline. What they offer is a continuum of price inflation updates underlining we continue to have a price inflation issue.
For its part, as shared, the Fed is immersed in a rate cutting cycle regardless of the reality of the above data.
Interestingly, continuing with a personal note of sharing observations on the reporting of the above data; I noted a consistent offering via you-name-it outlet that the above “improvements” offered further evidence the Fed has room to continue to cut interest rates.
Hey they were “in-line” right and as offered achieving in-line is evermore viewed as “All is good.”
The bottom line is we continue to have an obvious price inflation issue with the most recent data continuing to underline this fact.
I wish you well…..
-Ken from Mind Your Stops