

Another Six-Month Checkup - Stock Market Style

June 18, 2025
A couple of editions ago we did a six-month checkup of our ongoing monitoring of the interest rate backdrop. More specifically, we updated the long-standing megatrend of market-based (think bond market) interest rates and how the multi-decade trend of ever lower interest rates had come to an end, circa early 2022.
That storyline is one of several big-picture themes we have opened up along the path of recent years and continue to occasionally share within these editions.
Another storyline relates to the stock market. That is, more specifically, that collective stock market participants continue to bid a disjointed, if not unimpressive, overall stock market landscape.
Importantly, this is not a new story, which is why we continue to share various angles on this topic as we not only monitor it, and share it, but also participate within it as we deploy capital that has been entrusted to our stewardship.
The particular perch that we are viewing the broad market landscape from, within this edition, is one that surfaced quickly after the 2022 stock market rout.
For the bulk of 2022, the stock market was quite challenged, with the lows of that year offering 20-and 30-plus percent losses.
That was supposed to be the rout that cleansed the market and, in turn, left a setup for a brand-new, rock-solid bull market to launch from. Strangely, what collective participants have messaged via their trading of the market since 2022 has been a very strange bull market when using history as a guide.
We offer this observation of the post-2022 market landscape through the lens of historical, new bull market characteristics. To be clear, new bull markets, historically speaking, are very strong, robust, and broad in their participation.
Simply put, seemingly everywhere you look, stocks are moving upward with trends easy to spot across the spectrum of industries and sub-industries. Coming out of the 2022 stock market rout, this type of described landscape, of the stock market at large has been sorely missing.
Equal Weight vs. Weighted
As offered above, we have shared various angles from which to view the broad stock market landscape, in particular since coming out of the 2022 period.
Our six-month checkup relates to the ongoing watch of the S&P 500 Index. More specifically, we have shared over various editions the performance of the equal-weight S&P 500 index to that of the traditionally reported, weighted S&P 500 index.
In the traditionally reported version, the S&P 500 stock index has certain companies that carry a large weight within the construction of the index and, as a result, have an outsized impact on its performance.
If a couple of handfuls of companies comprise a notable total weight of its construction, they collectively can make it appear the stock market as a whole is performing quite well, provided they themselves are trending upward via stock price appreciation.
The equal-weight version erases this potential issue, as all 500 companies carry the same weight, and in so doing, a handful of companies cannot have an outsized impact on the index performance.
With the above in mind, we can then place the two together in a chart to see which of the indices is outperforming. Adding to this, we can also use this as a historical tool and run the chart with some history to point out how the relationship typically acts when entering a new bull market period.
In one fell swoop we can do a quick view of the general stock market landscape via these two differently constructed S&P 500 indices.
Click For Larger View: https://schrts.co/HngXPpJi
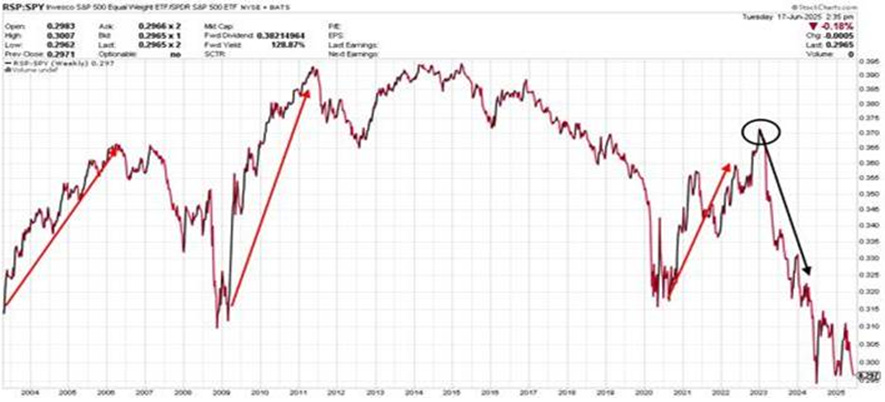
The above chart encompasses this 21st century in order to get some historical perspective. When the line chart is moving upward, this tells us that the equal-weight S&P 500 index is outperforming the weighted S&P 500 index.
The significance of such outperformance is that the broad stock market is fully participating. This is one of many tools to help gauge the true strength of the stock market at large.
Our red arrows denote the liftoff of new bull markets, from the general wreckage of the previous bear market, in the past 25 years.
It is customary for a new bull market to be strong and robust across the market landscape. The outperformance (line chart trending upward) of the equal-weight S&P 500 to that of the weighted version offers a broader, more robust bull market landscape.
More to our current period, our black down-trending arrow highlights the strange behavior coming out of the 2022 downturn.
Rather than the equal-weight S&P 500 index kicking into overdrive with a continuing strong uptrend, it did a historical opposite and has essentially nosedived in comparative performance to that of the weighted version.
To the lower right of the chart, we see in the last year this market landscape gauge has really struggled to gain any traction at all. It is stuck at its low level while it threatens to move to a new low point.
On a personal note, at times, I am amazed when reviewing the above chart at how challenged the broad stock market is, performance-wise, relative to the more narrow, weighted S&P 500 index.
Digesting the chart in its totality, our current bull market era (think post-2022) sticks out like a sore thumb relative to past periods, as highlighted by our red arrows.
The bottom line of all of this is yet another corroborative offering that collective stock market participants have been, and continue to be, selective in what they are willing to bid up on a trend basis.
In our previous edition, our look at the stock market through Dow Theory offered a similar conclusion. There are other tools chiming in with these conclusions as well.
The above is one more aspect of the market landscape that affirms selectivity, at this juncture, continues to be the operative approach.
I wish you well…
-Ken from Mind Your Stops