

And then we have Valuations to Consider

May 21, 2025
While there is a lot of daily and weekly noise radiating from the economic and market landscapes, the pricing of X market(s) is consistently quoted and discussed as though market prices are a tell-all.
“The Dow went up 200 points today, and in other news….” but through all of the chatter on the general health of the economy, with a typical follow-on discussion of various markets, what is rarely discussed is what those prices are telling us when placed into some form of context.
Valuation is a process, or a tool shall we say, that offers a perspective of price for X market being quoted.
If I say to you, I have decided to sell my lemonade stand and am asking an arbitrary $50,000 for it, all you know, at that point, is the asking price. Interestingly, regardless of your business or economic acumen, you will intuitively begin thinking of at least some basic questions.
What you are intuiting is the need for context. $50,000 gives you next to no information that will help you process whether that figure is a bargain or laughable.
Basic questions may quickly arise. For example, what type of sales levels does this lemonade stand achieve on a monthly, quarterly, and annual basis? What level of profits from those top-line sales figures does this lemonade stand bring down to the bottom line?
Also, what about labor costs? Surely you would ask that in light of the potential of whether you would be running the lemonade stand yourself, and if so, could you increase the profitability of the stand in light of being able to cut labor costs by running it yourself.
We could go on and on with these questions as this is precisely what someone does upon even entertaining the purchase of a business, regardless of how large or small. They are trying to place price into context to determine whether it offers value, or if it is a nonsensical asking price.
On a personal note, I have always been amazed at how seemingly any individual who has a business presented to them, for purchase, will immediately begin thinking of placing the price into context, but rarely, if ever, asks any such questions relative to their approach of purchasing stocks, or the stock market at large, via an index-based purchase.
I realize potential kneejerk reactions to my sharing of my many observations of this disconnect. “Ken, the market always goes up, there is no need for such questions.” It does? The market always goes up? “Plus, you cannot time the market.” (I have heard both countless times.)
Wait, because someone believes it is impossible to time the market does this simultaneously mean that same person should never have a sense of what they are paying for when buying the businesses listed on the stock market?
Back to my lemonade stand offer of $50,000. Does this mean if I can list it on a stock-exchange I can price it at $100,000? If the same impromptu questions that arose when I was selling it as a private business, do not arise at all, if priced within a stock exchange, then why not?
If market participants have a rock-solid belief that stocks always go up, and hence, have no need to ask contextual valuation questions, then why not double the price?
Let’s take a moment and delve into the view that the stock market always goes up.
Stock market history offers this is patently false.
If you have a kneejerk reaction to this that offers something like, “history sure, the stock market did go down at different times for long periods such as in the Great Depression, but not in modern times”. That view would also be false.
For example, what if I told you, or reminded you may be more applicable, that from the year 2000 through the front part of 2013, the S&P 500 index, on a price basis, went nowhere but up, down, and all around.
For its part, the NASDAQ Composite index did not exceed its year 2000 price level until early 2017! (Price basis means excluding any accumulation of dividends.)
The high attained in the year 2000 was not exceeded until we progressed down the timeline to early 2013 for the S&P 500, and 2017 for the NASDAQ Composite. That is a near-eternity if holding the view that the stock market always goes up. The 1966 through 1982 period is another era of such price action.
Market episodes such as those are known as long-term trading ranges.
Price moves up, down, and all around but through it all, as the years add up, price does not trend to a higher high. Rather, as the process unfolds, the lost ground is made up as time rolls on. Ever higher highs – think an actual uptrend – do not show themselves for a long while.
Many specifics can be delved into to describe what the underpinnings were of any particular long-term trading range. Keeping to our subject for this edition, valuation levels are a big-picture generality that casts a very wide net over these long-term ranges.
Succinctly stated, market participants can and do get ahead of themselves in pricing, and hence valuing individual companies, as well as the stock market as a whole, at times.
This takes us to our central observation through the lens of market valuation levels.
Regardless of personal views and belief systems as to whether the market always goes up, and with this, cannot be timed, having a sense of what general market valuations are is always a good information piece for any market participant to hold, within their general knowledge base, relative to the stock market.
Importantly, there are many ways to place individual companies, as well as the stock market as a whole, into a valuation context. Below we address the stock market as a whole relative to the size of the nation’s economy.
This offers a big-picture view of how high, or low, the stock market is valued relative to the economic activity that ultimately supports the sales and profits of the component companies making up the stock market.
As an aside, this measure has also morphed into a slang name known as the “Buffet Ratio” or “Buffet Indicator” named after famed investor Warren Buffet in that it is one of his favorite valuation measures.
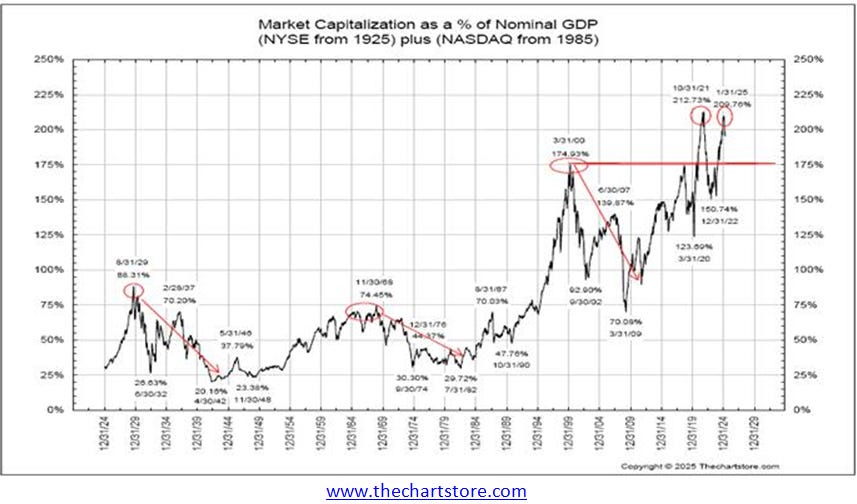
Above is 100 years of history to draw upon when taking the stock market capitalization (dollar total of shares outstanding for all companies combined) as a percentage of the nation’s nominal GDP. We give a hat tip to Ron over at The Chart Store for always compiling this historical data. It is an invaluable data point as a big-picture valuation metric.
Within the chart, we have circled key high-water marks in this valuation metric along the timeline.
In 1929 this metric topped out at 88% of GDP. In the 1966 era, it topped at 75%. Up to that point in time, both levels were at, or near, high water levels experienced since the inception of the above chart. Continuing, in 2000 this metric topped out at 175% of GDP.
After each of our circled peak periods, we inserted red downtrend lines to highlight the gradual easing of those highly valued markets to something more historically recognizable.
Think our aforementioned long-term trading ranges eased off the boiling valuation levels, stocks had been priced up to, relative to the size of the nation’s economy via the GDP metric.
Our Current Era
Our red horizontal line highlights the peak level attained in 2000, and through this, how historically richly valued the current stock market is relative to the size of the economy.
Our current readings, via our far upper right circles, have the stock market valued at over twice the size of the nation’s economic activity. This is unchartered waters. Stock market capitalization being twice the size of the nation’s economic activity is historic.
Given time, will this era be pointed to as the beginning of another long-term trading range as has occurred throughout the previous 100 years?
Another way to look at a long-term trading range, for the stock market as a whole, is to label it the proverbial stock picker’s market.
That is, collective market participants become much more selective in what they are willing to bid higher, on a trend basis, compared to that of a market backdrop where the stock market as a whole continues to trend upward.
Long-term trading ranges, induced by extreme valuation levels do not mean every stock throughout the market landscape goes essentially nowhere, via an unfolding large trading range, but rather, said market environment goes old-school as a market of stocks, think selectivity.
What we know currently is that the stock market is very richly valued when viewed in a big-picture sense, as depicted above. Such valuation extremes do not provide any certainty as to whether this will lead to our current era morphing into a long-term trading range, such as the previous high-water marks circled within the chart.
Historically richly valued markets can always become more richly valued. Valuations are not meant as a timing tool as much as they are meant to give context to participants on the asking price of the collective stock market businesses.
For now, we continue to watch and monitor with an understanding that our current stock market is quite expensive when viewed through the above, as well as other valuation measures.
We will share other valuation angles in future editions. As shared, there are many ways to place price into context to get a sense if current asking prices, for stocks as a whole, offer value to a potential purchaser.
Memorial Day
Our calendar offers Memorial Day weekend is approaching quickly. We will be skipping a publication week with said calendar. We will share our next edition in early June.
In honoring Memorial Day, in advance, we offer a salute to our fallen service members, who gave the ultimate sacrifice, including any surviving family members. Thank you.
I wish you well….
Ken from Mind Your Stops